
Location Kadıköy, Istanbul as pilot
Year 2017
Job description Research and method development for location-mining
Status Ongoing
Location mining research is an ongoing method finding study that we have started in March 2017. The project aims for finding free data resources in the urban scale and develop methods to scrape the data, map it and create visual statistical analyses.
The maps are using data retrieved from sahibinden.com (a website for classifieds, similar to Craigslist or Gumtree), yemeksepeti.com (a website for ordering food), iett.istanbul (Istanbul’s official public transportation website), Instagram, Trafi, Google Maps, tripadvisor.com. The common feature for these data sources is that their content is mainly provided by its users, in other words they are all volunteered geographic information. This feature was the basis and originating point for the entire research: Currently, we are swimming in a large pool of data streaming all around us. The tweets, selfies, check-ins, likes, ignores, pokes, snaps, listings, stars, user comments constantly keep updating and adding to this pool. Mostly consisting of unorganised, unfiltered and uncategorised raw data; this pool is the ultimate collective subconscious of our society. It has the information on what people like doing where, when, how; how they travel; how they spend their free time; how they speak to each other; what their share of economy is; how they take what was created and transformed them.
This is a fantastic information source for anyone wanting to understand the geospatial past, current and future in further detail.
The perplexing question is that, why don’t we, architects, some of the ultimate social life manipulators, use this information when shaping our designs? After all, sustainability is about creating self-sufficient environments so that consuming additional resources will not be needed; and what can be more self-sufficient than what the user actually want and need?
Below can be seen several maps of Kadıköy district of Istanbul, created by our own custom-made Phython and Rhino/Grasshopper scripts.

1. Public transportation routes of bus and metrobus lines (iett.istanbul); 2. Minibus and dolmus lines (Trafi app); and 3. Routes for running and bike rides (Strava Labs)

1. Unit prices for rental houses (from the ads that were online between December 2016 to April 2017); 2. Unit prices for houses for sale; and 3. Payback time, interpolated from the unit prices
Ages of the buildings. Navy dots represent newer buildings built in the last three years and purple ones represent buildings older than 30 years.

The number of bedrooms. Notice how smaller houses correspond with the newly built ones, as seen in the previous maps.

1. Instagram posts with their likes, showing the social life axis; 2. The residential/non-residential areas, black means the building is fully non-residential and white means fully residential (from GIS model)
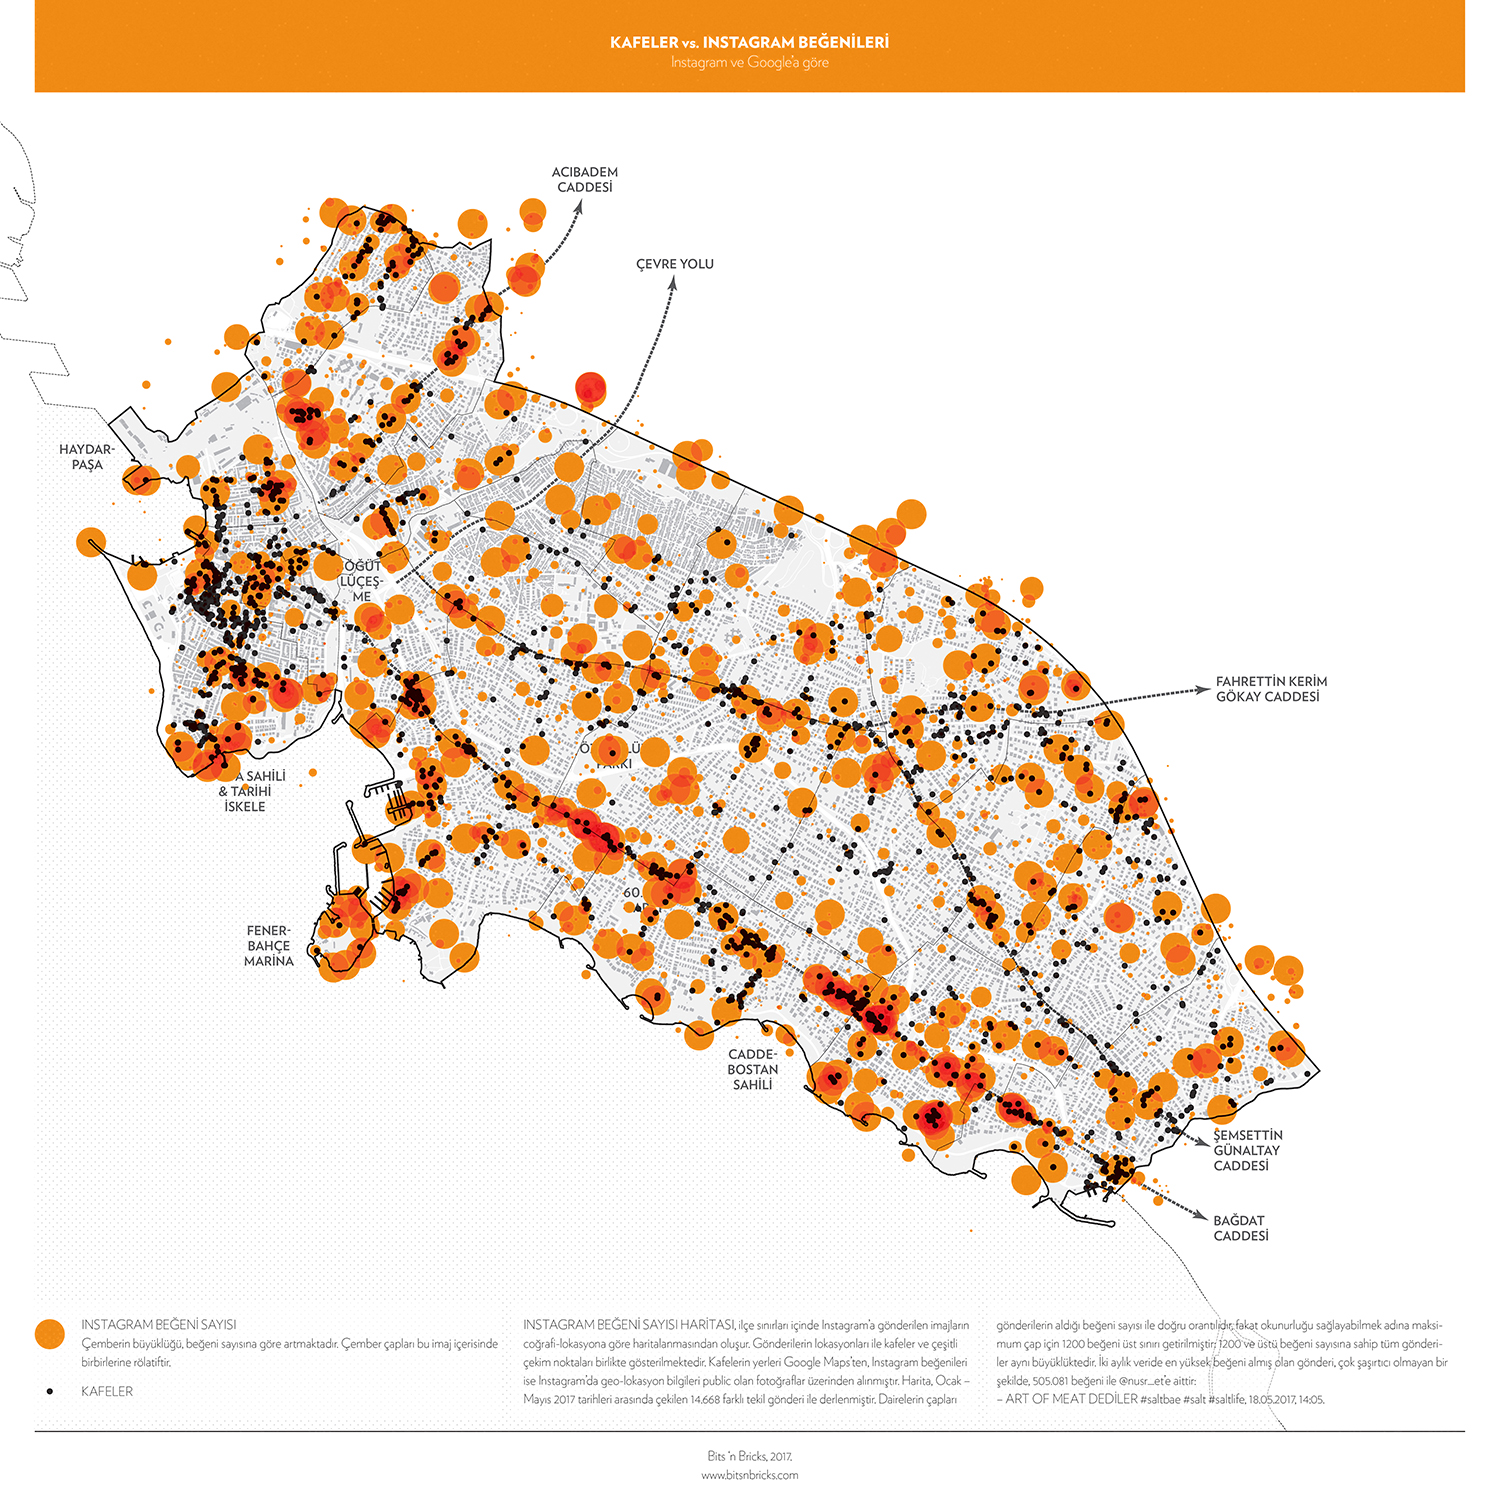
Instagram posts and their likes. Orange circles grow larger as the posts get more likes. Black dots represent the cafe and restaurants taken from Google Maps.

Hashtag map. Most popular hashtags are listed in each respective virtual grid. The orange grids represent where hashtags are mostly related to sports and workout, while purple grids have mostly make-up and hair hashtags.

Ayran and Coca Cola prices, from the menus in yemeksepeti.com. The prices range from 1 TRY to 8 TRY for ayran and 2 TRY to 8.5 TRY for Coke. 1 TRY is roughly 0,24 Euro.

The restuarants serving take-away food at night. Each circle with different colour represent the time period that the restaurant is still open for online ordering. From yemeksepeti.com.
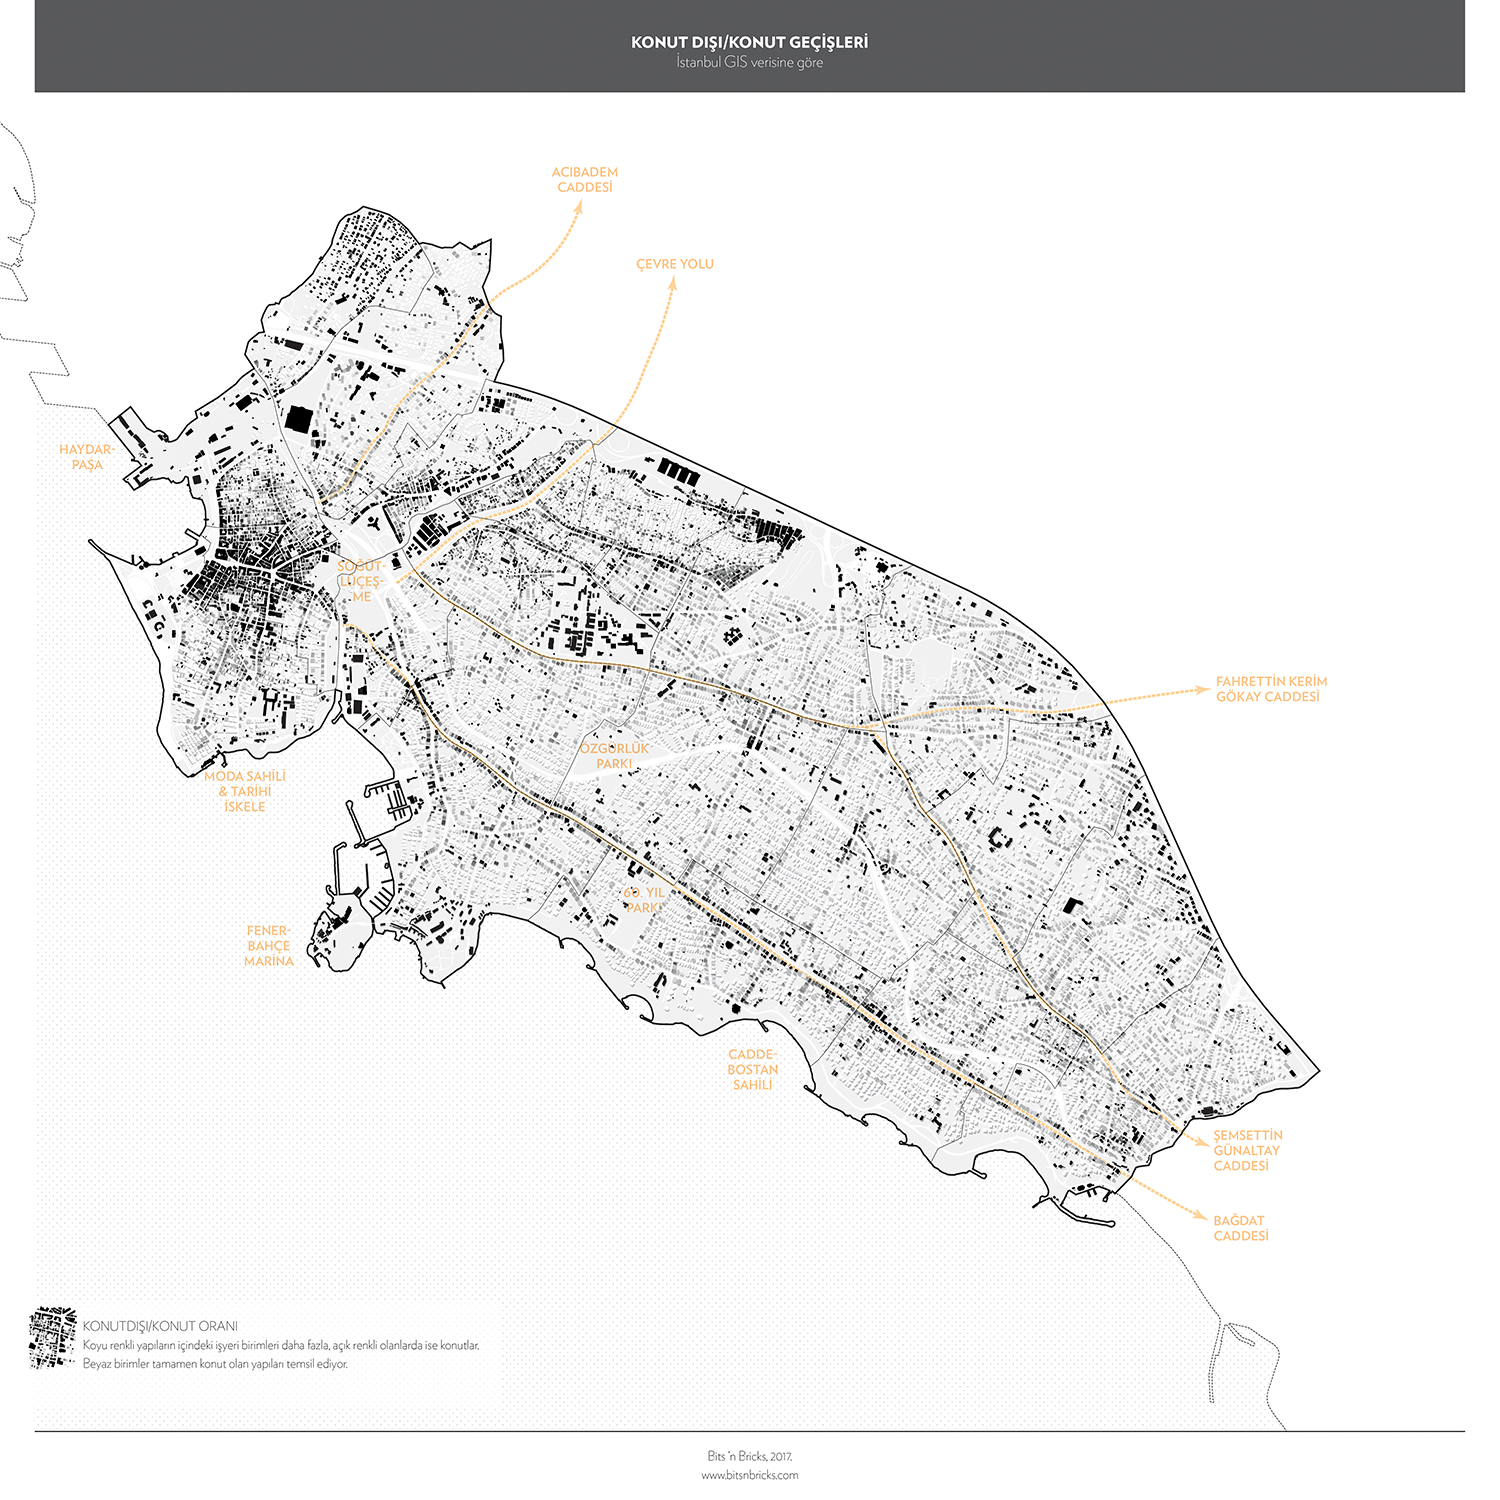
The residential/non-residential areas. Black means the building is fully non-residential and white means fully residential. From the GIS model.

Bus and metrobus lines, and their stops. The thicker lines mean that the bus line following that route has more service in a day. The darker the lines get means more bus lines overlap in that route. The larger the circles get means more lines stops there. From iett.istanbul.

Minibus and dolmus routes. From Trafi.

Running and bike ride routes. From Strava Labs.
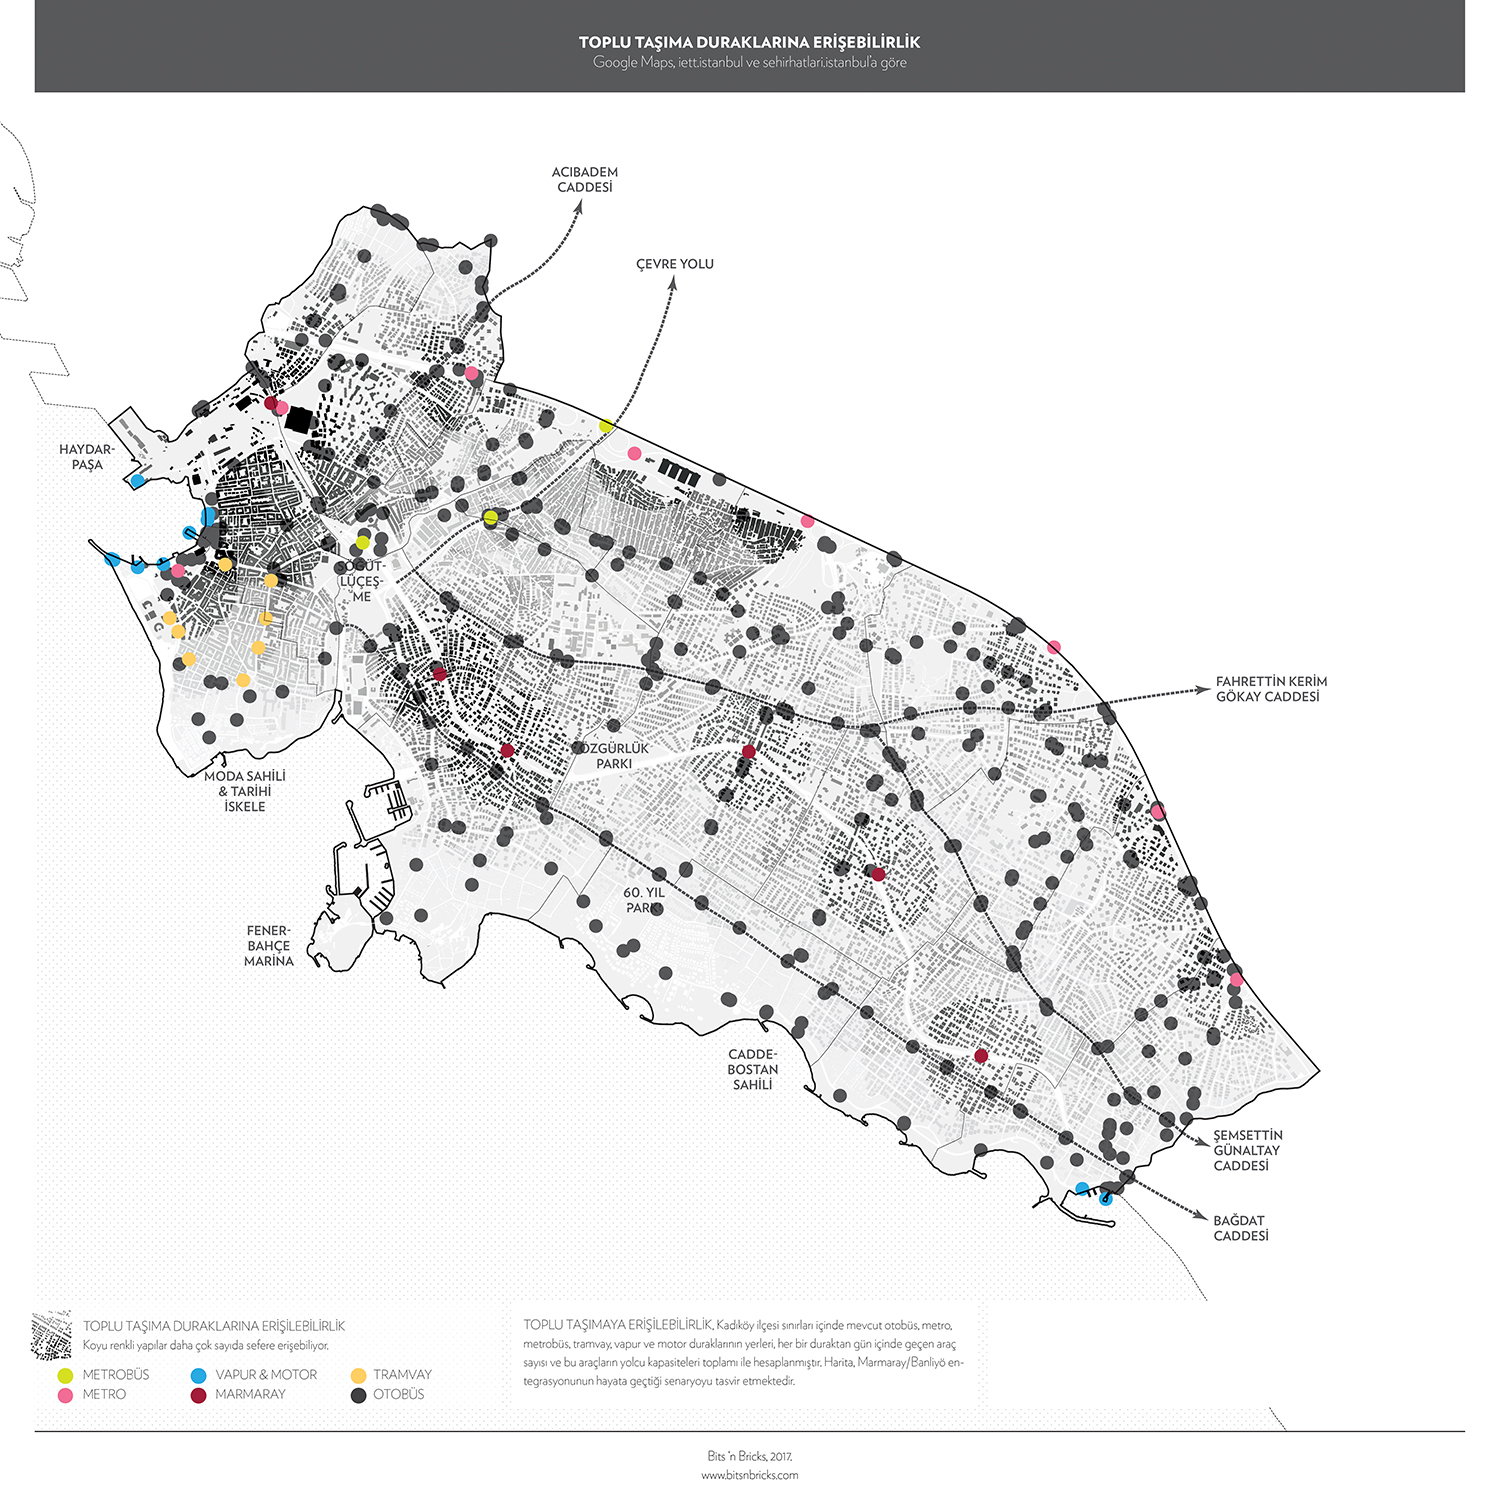
Accessibility to public transportation. The blacker the buildings get, more public transportation seats the person can access within walking distance. Calculated using the bus, metro, metrobus, train and tram lines’ daily capacities.

Accessibility to green areas. The blacker the buildings get, more green areas/parks are accessible to the person within walking distance.
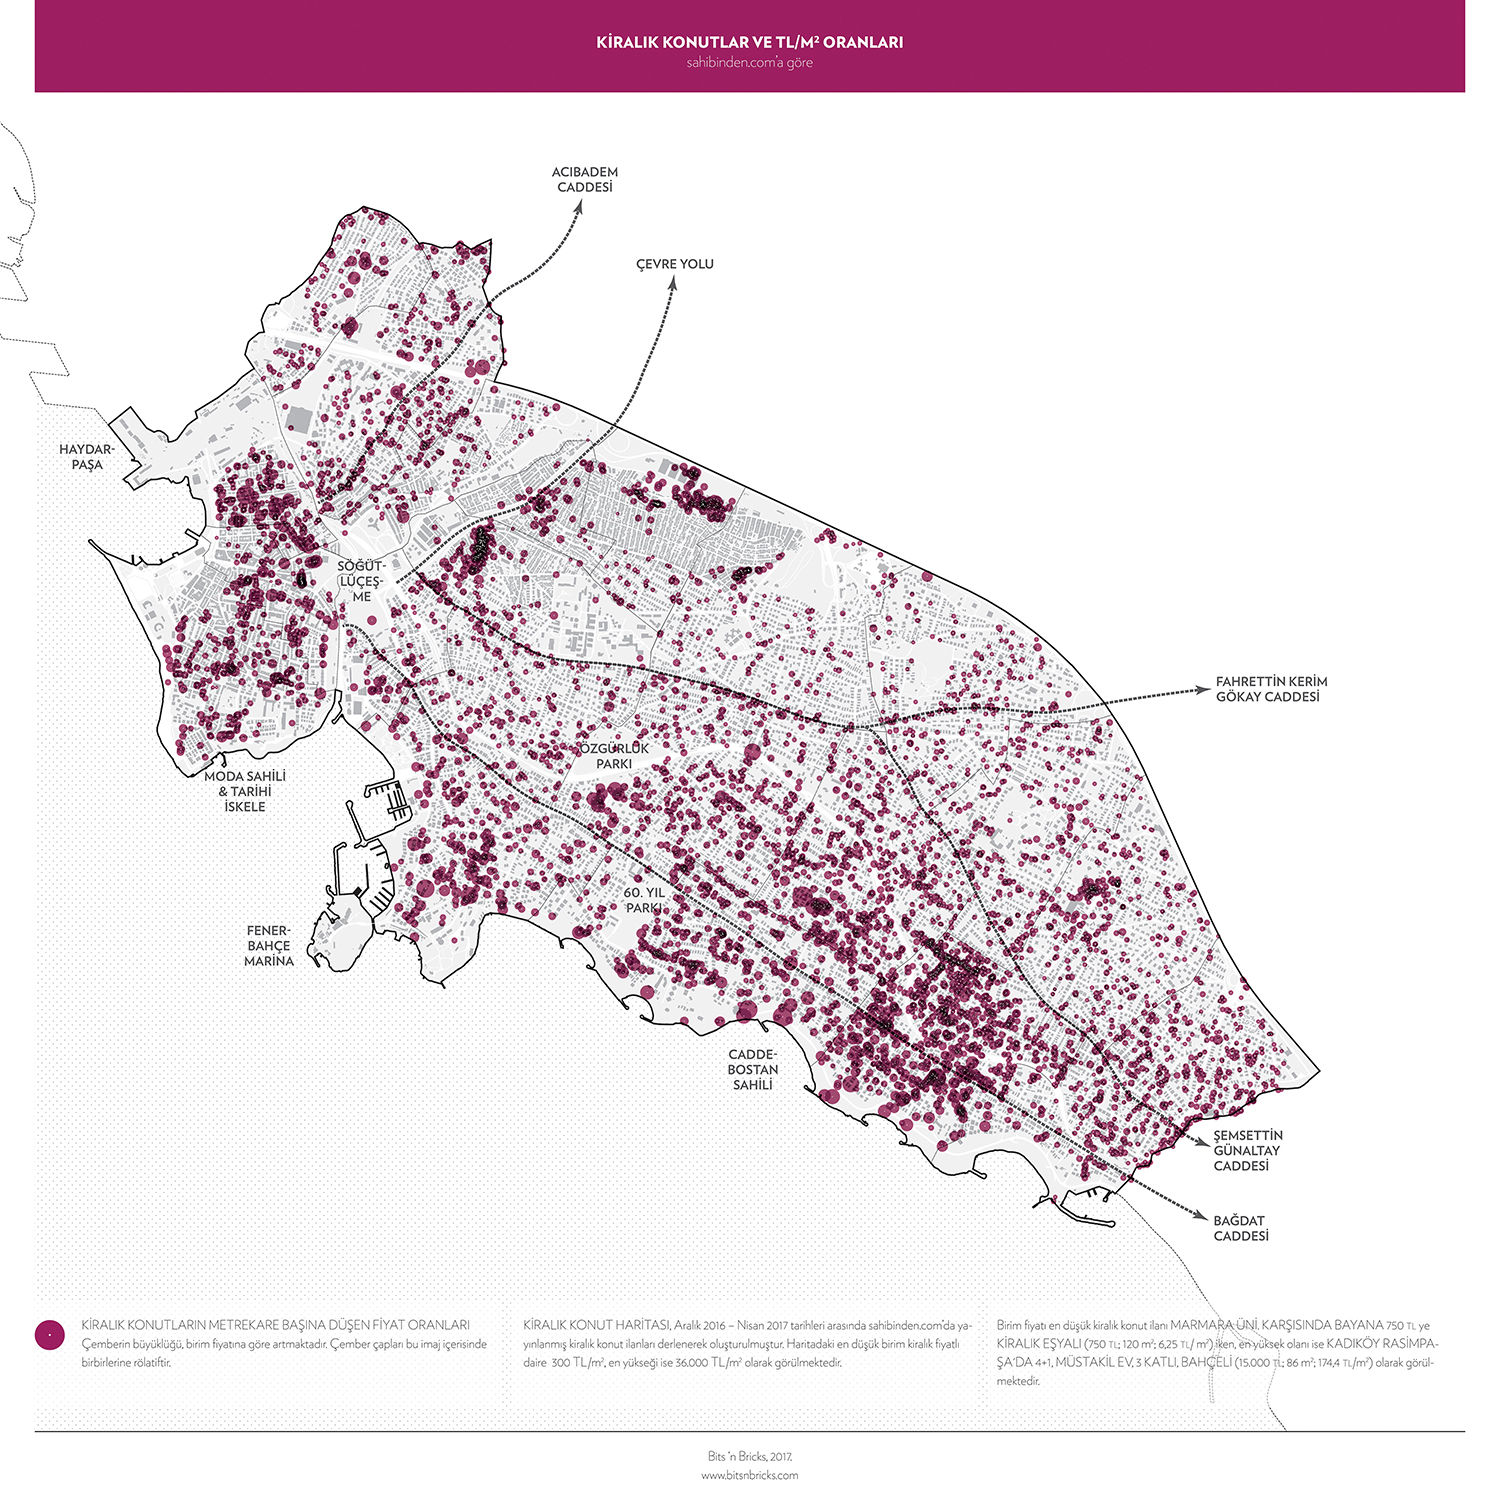
Unit price for rental houses. The larger the circle gets, the higher rent/sqm gets. From sahibinden.com.
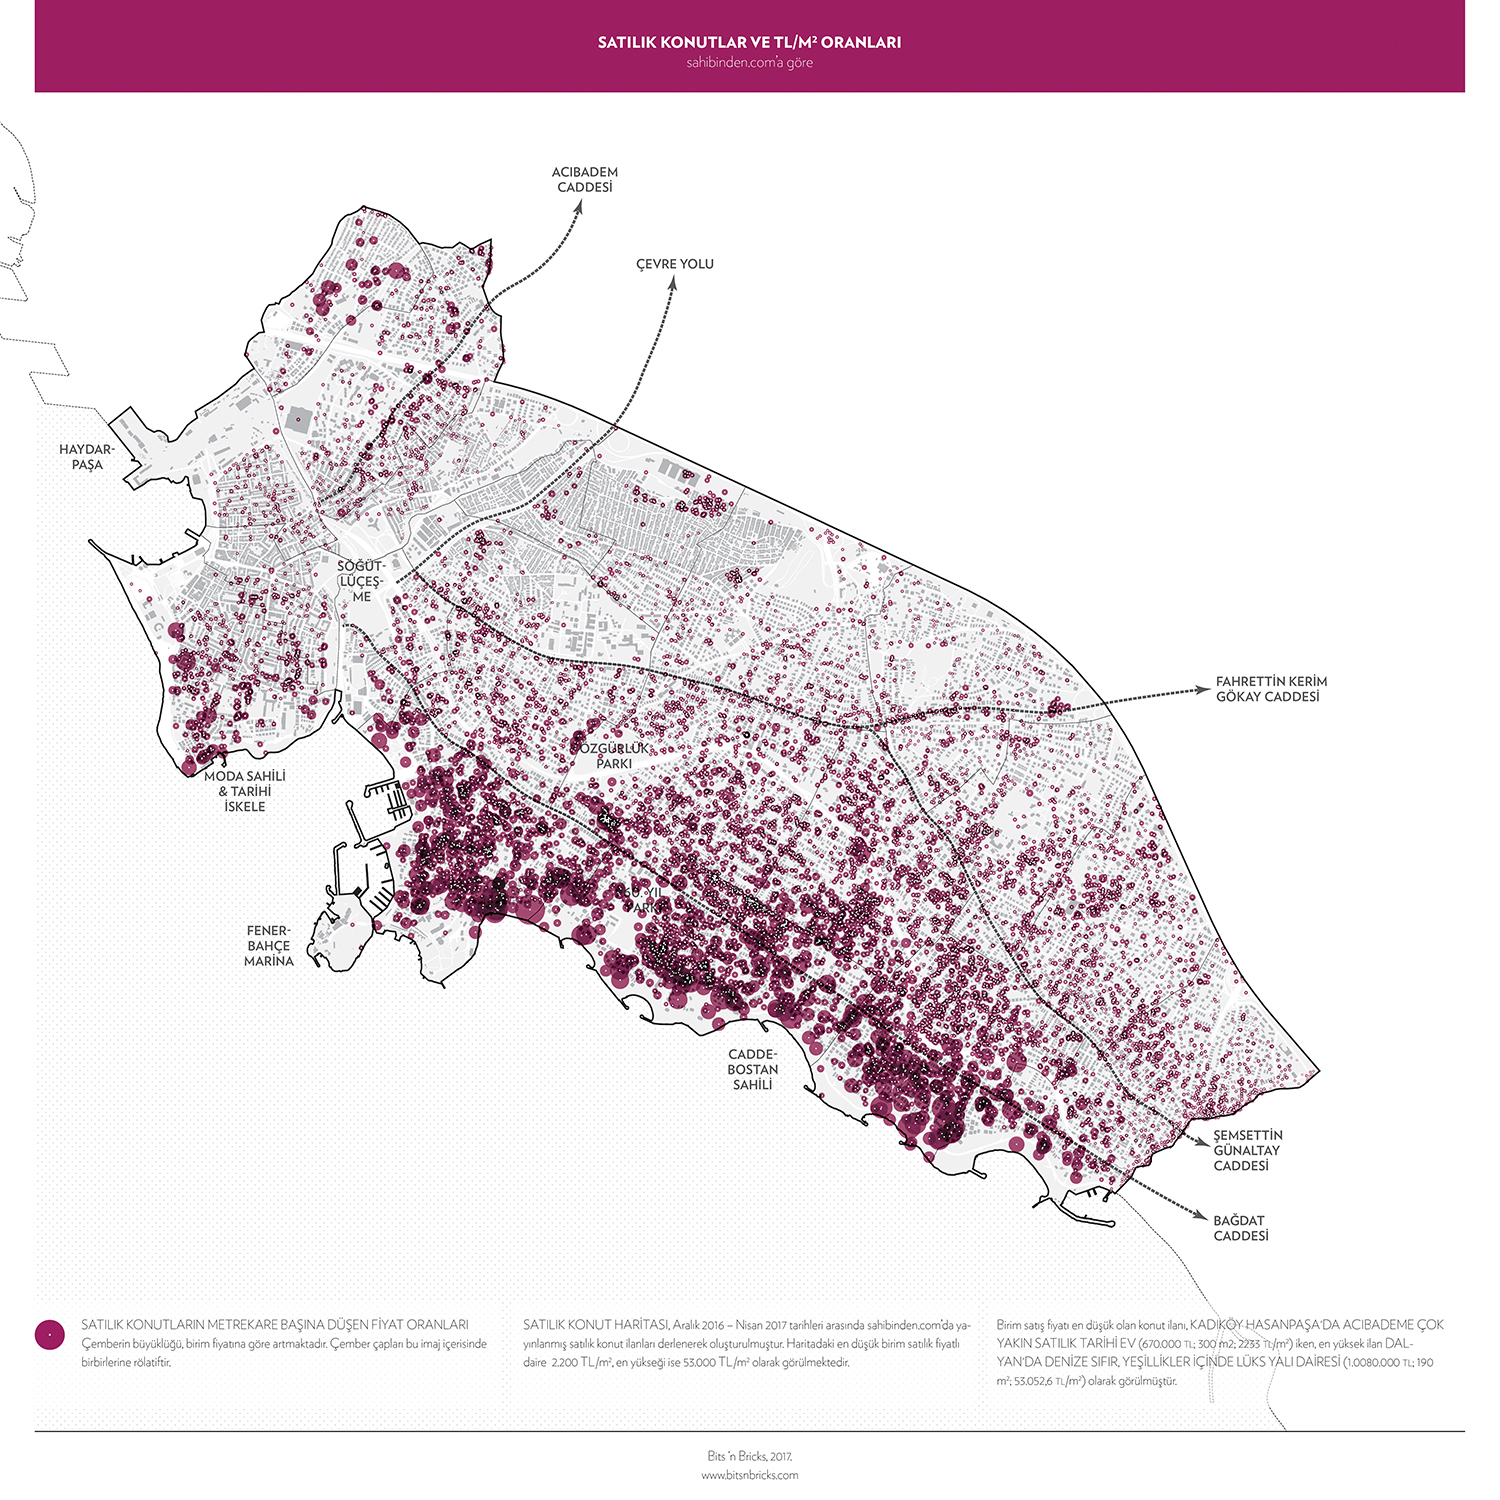
Unit price for houses for sale. The larger the circle gets, the higher sales price/sqm gets. From sahibinden.com.
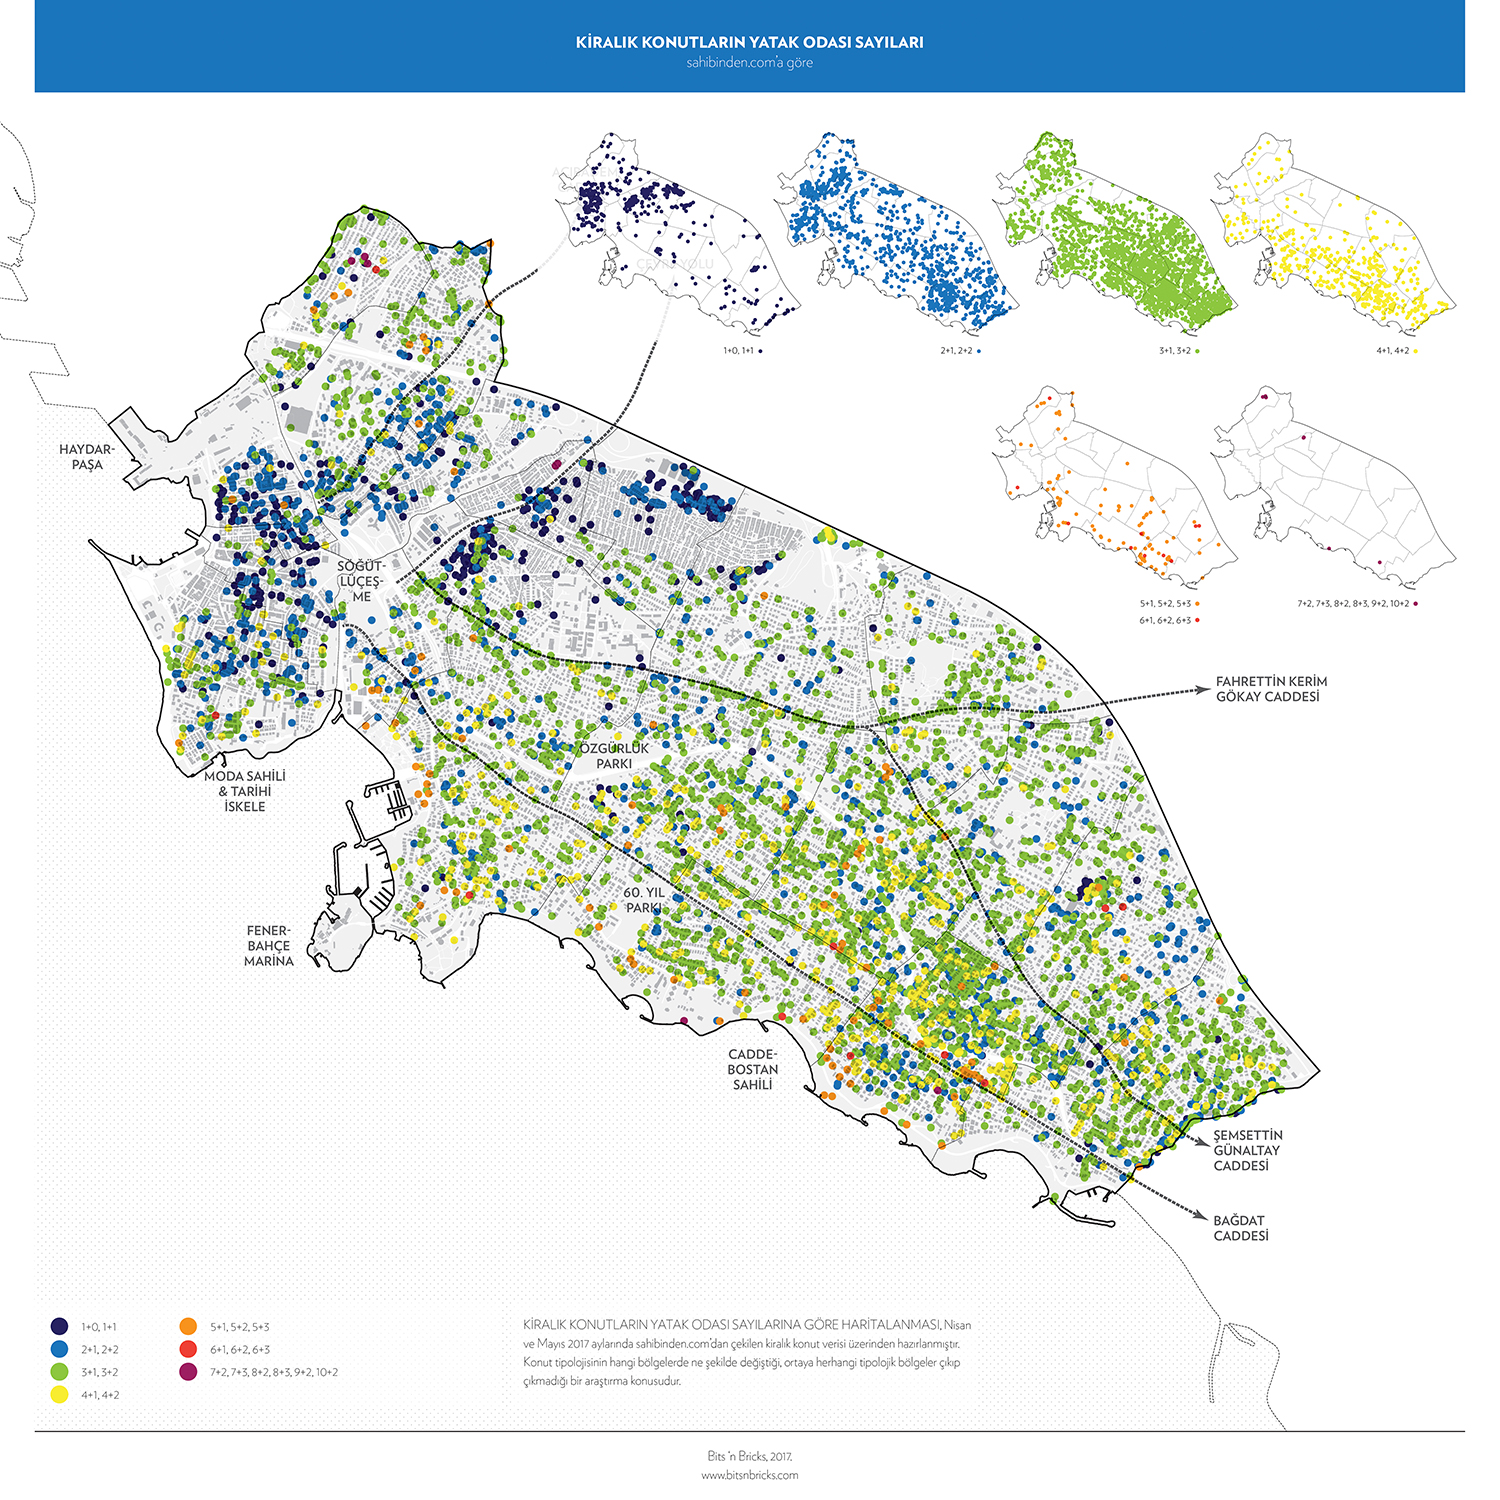
The number of bedrooms for each rental house. From sahibinden.com.
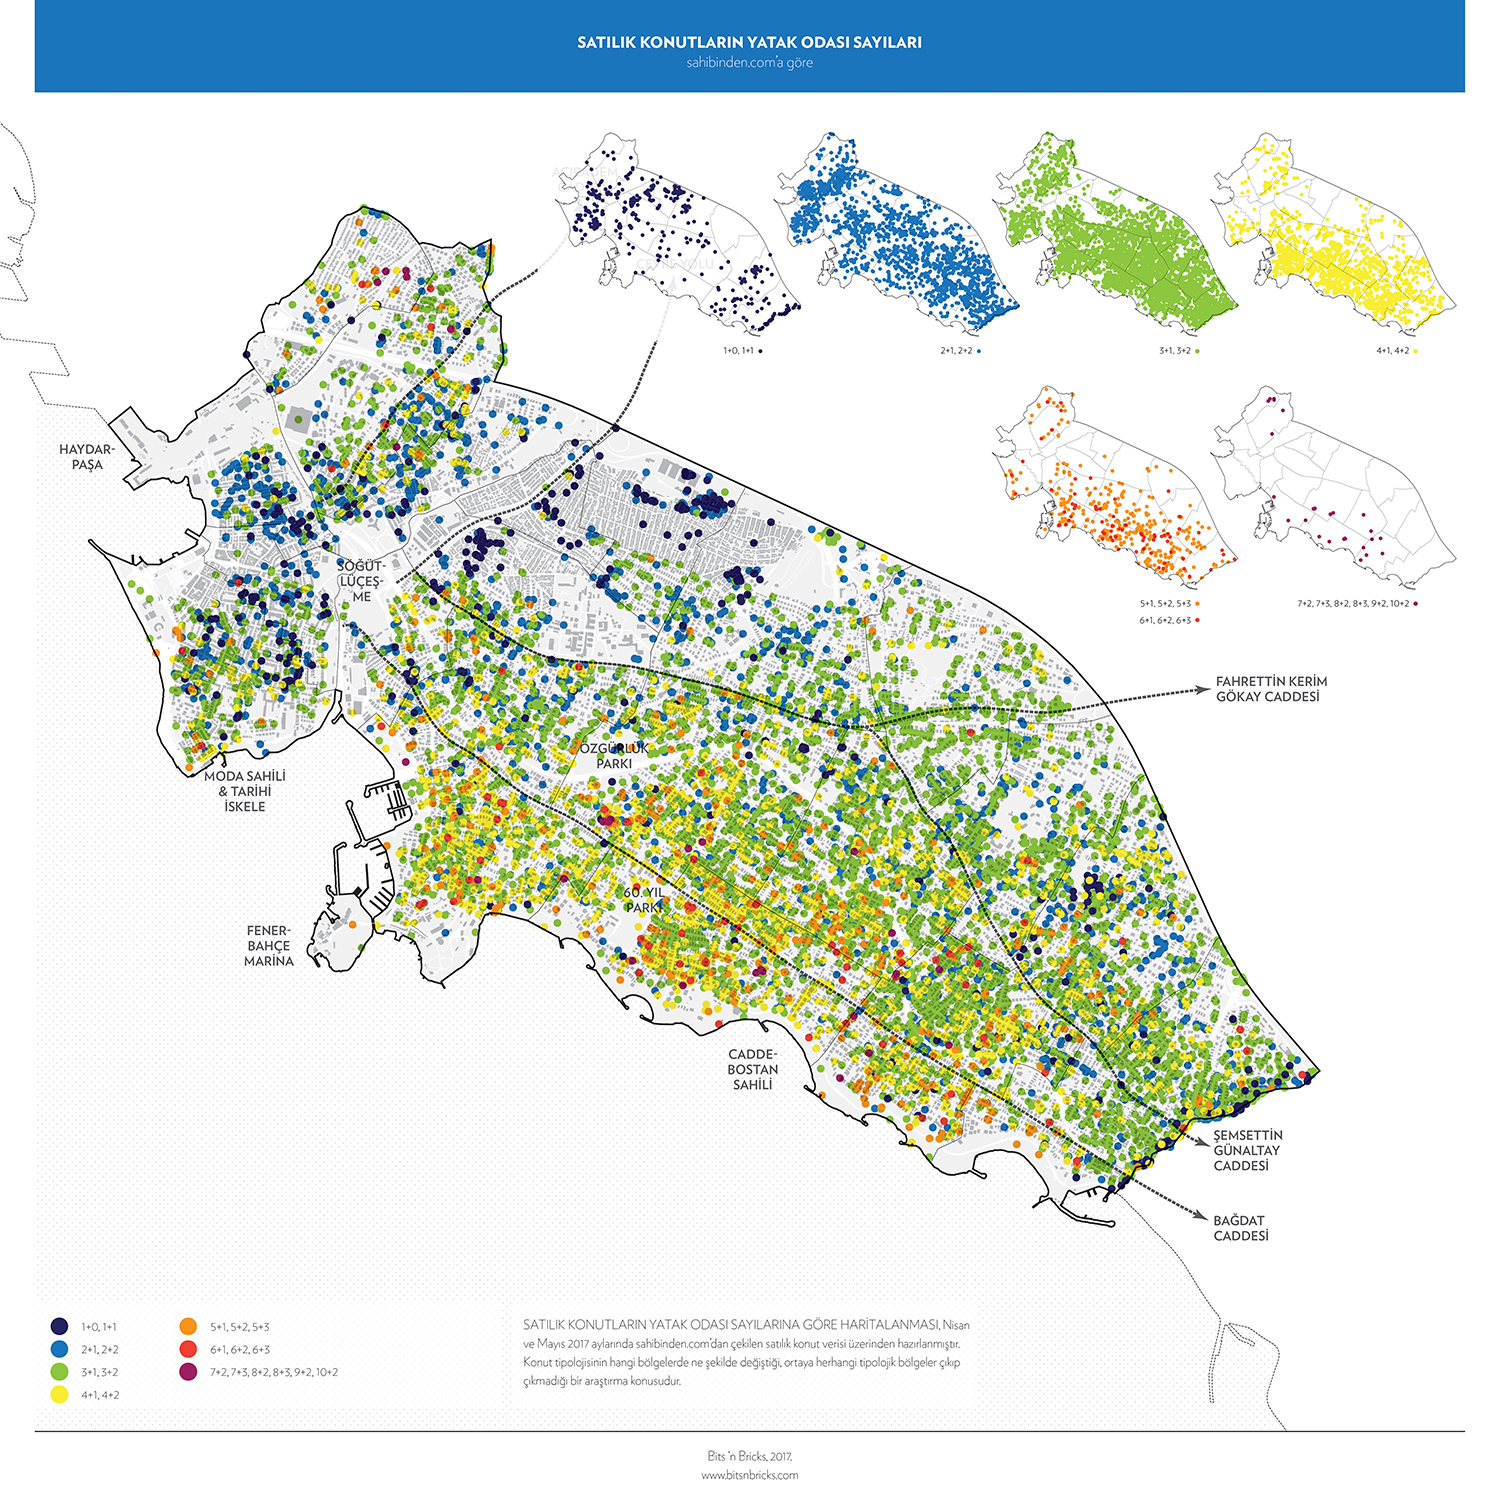
The number of bedrooms for each house for sale. From sahibinden.com.

Payback times, if you buy a house and rent it afterwards to compensate for you initial investment. Calculated based on the two previous maps.

Ages of the buildings. From sahibinden.com.

ATMs and banks. From Google Maps.

Shopping for women’s clothing, and Starbucks locations. From Google Maps.
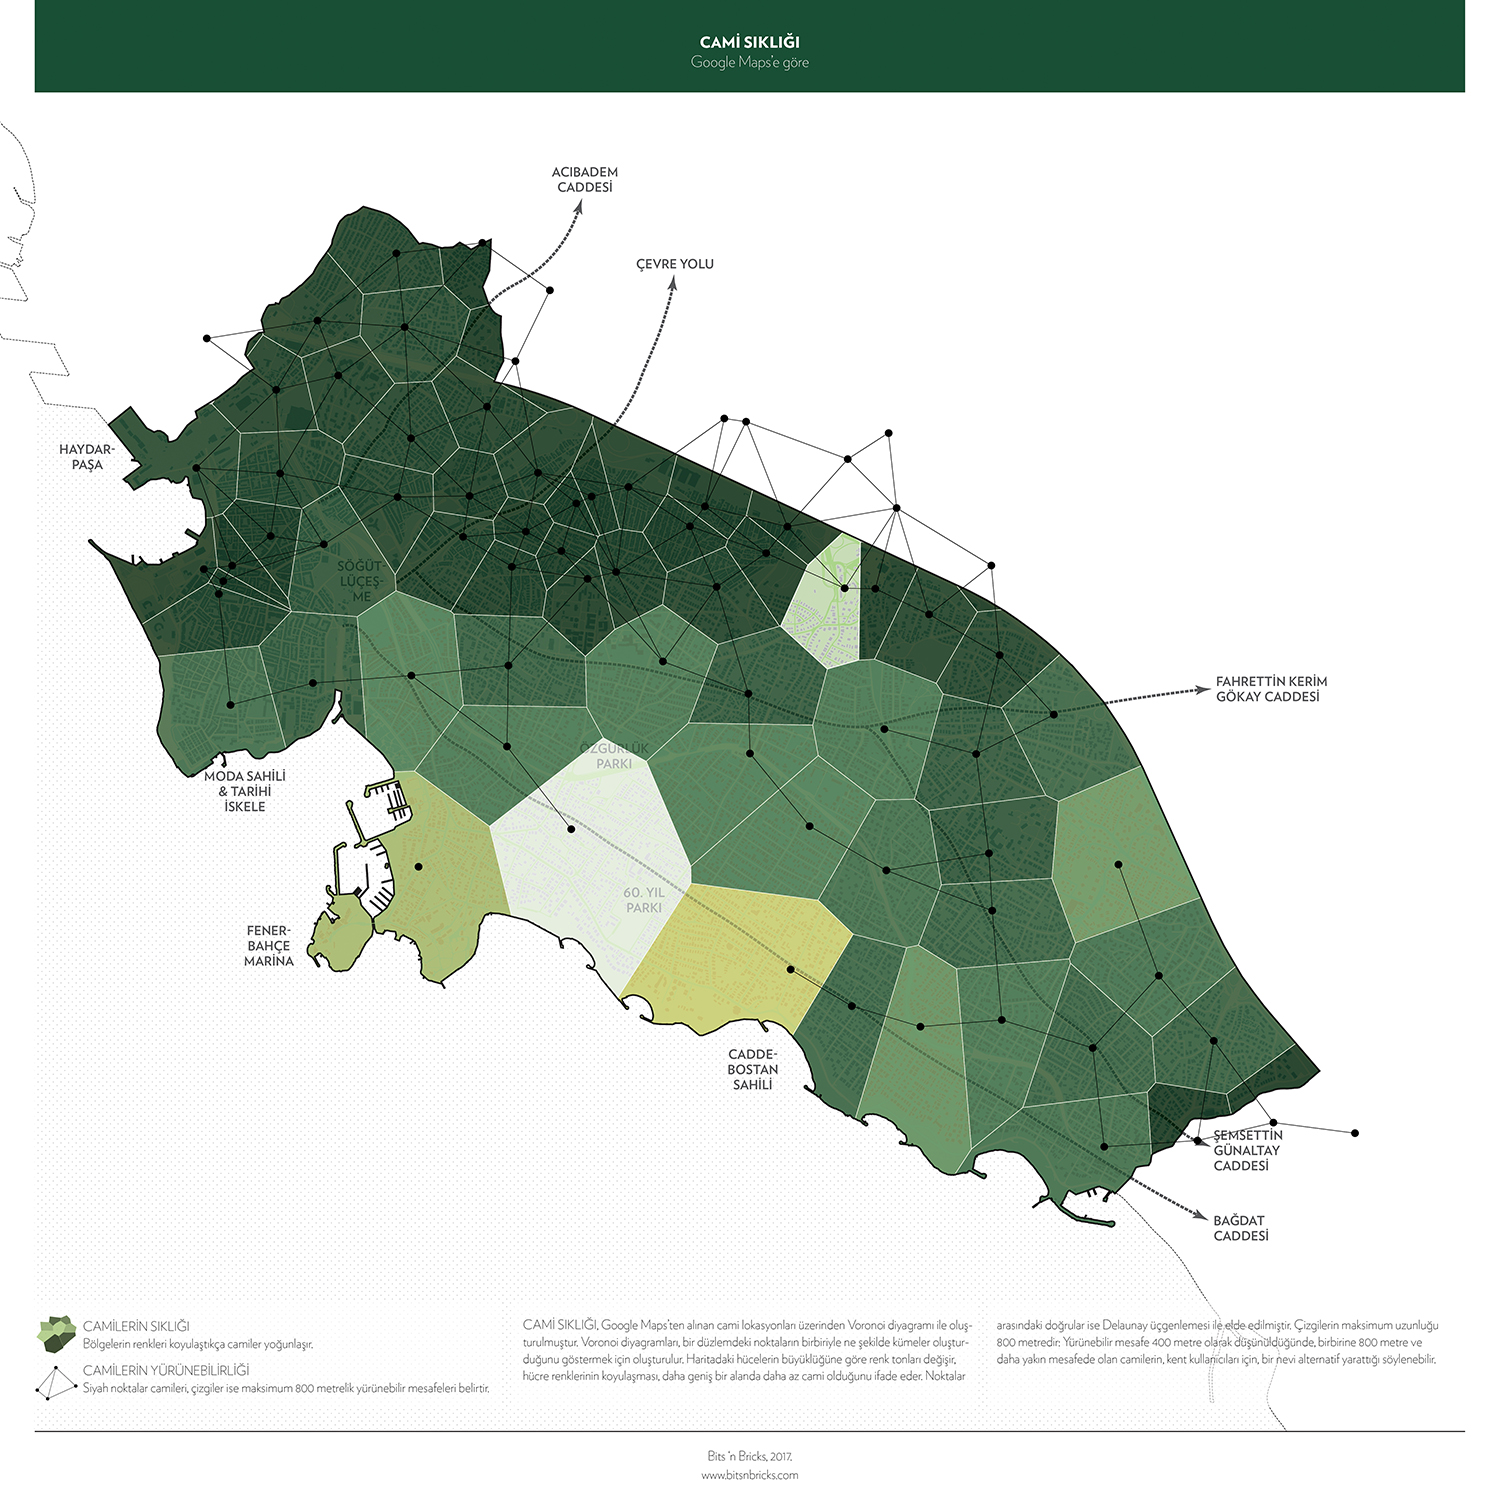
The mosques and their walkability. Voronoi cells change their colours according the the number of mosques vs. walkable distance.
